Week #4: Probability and Statistics for Data Science
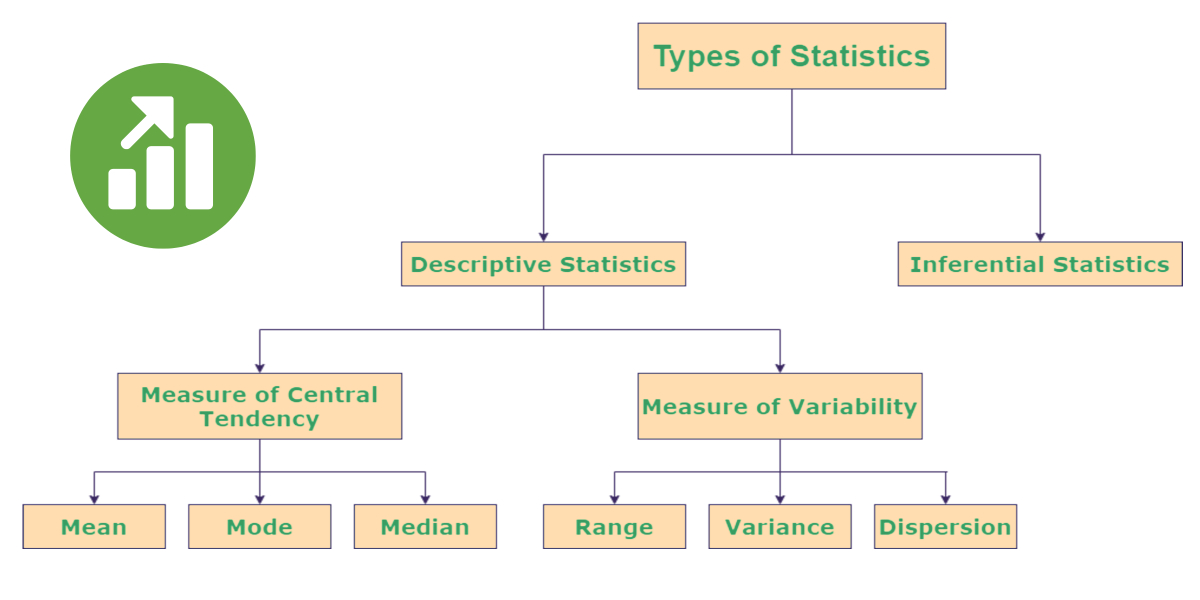
In this chapter, there are two topics, the first being descriptive statistics. These are statistics that are numerical and have value. Things like mean, median, mode, range, variance, and standard deviation. These are all tools where you can have a group of data, and from these tools, you can learn more about the data. The second topic is probability distributions. This is when you take the data and find the probability of certain outcomes happening through the use of the data. An example would be if you have a group of data and the average is 70. Numbers around this value are going to be more likely than ones significantly greater or less than 70.
AI can be really useful for making predictions about data and what's most likely to happen in the future because it has all the tools and lacks bias. If you made a chat bot to read and predict trends based on the data given and the situation, it would have the same, if not better, results as if a human did it. You, of course, would need to check to make sure the bot is right about its math. The downside of this is that some data is very sensitive and cannot be used in AI because of the privacy it lacks. But as AI gets better and better, who knows what the possibilities are for what AI can do with data?


Comments
Post a Comment